

"We are hard to reach." We often hear that sentence. But when we ask how bad it is, there is silence. Is it one in ten missed calls? Or three in ten? On Monday morning or the whole week?
Without numbers, accessibility is a feeling. With numbers, it becomes something you can improve.
The six numbers you need to know
1. Service Level
What portion of the calls is answered within a fixed time? For example, 80% within 20 seconds. This is your most important metric.
2. Average Waiting Time
How long does a caller wait on average before someone answers? Also look at the outliers. An average of half a minute can hide peaks of five minutes.
3. Abandon Rate
How many callers hang up before speaking to someone? A high percentage means: people are giving up.
4. Missed Calls Without Follow-up
A missed call is not a problem if you call back. So it's about the calls that no one followed up on.
5. Traffic per Hour and per Day
When is everyone calling? With this insight, you can plan your staffing more wisely instead of placing the same number of people everywhere.
6. Distribution Among Employees
Is one colleague answering half of all calls? Then you have a risk, and probably a tired colleague.
Where do you get these figures from?
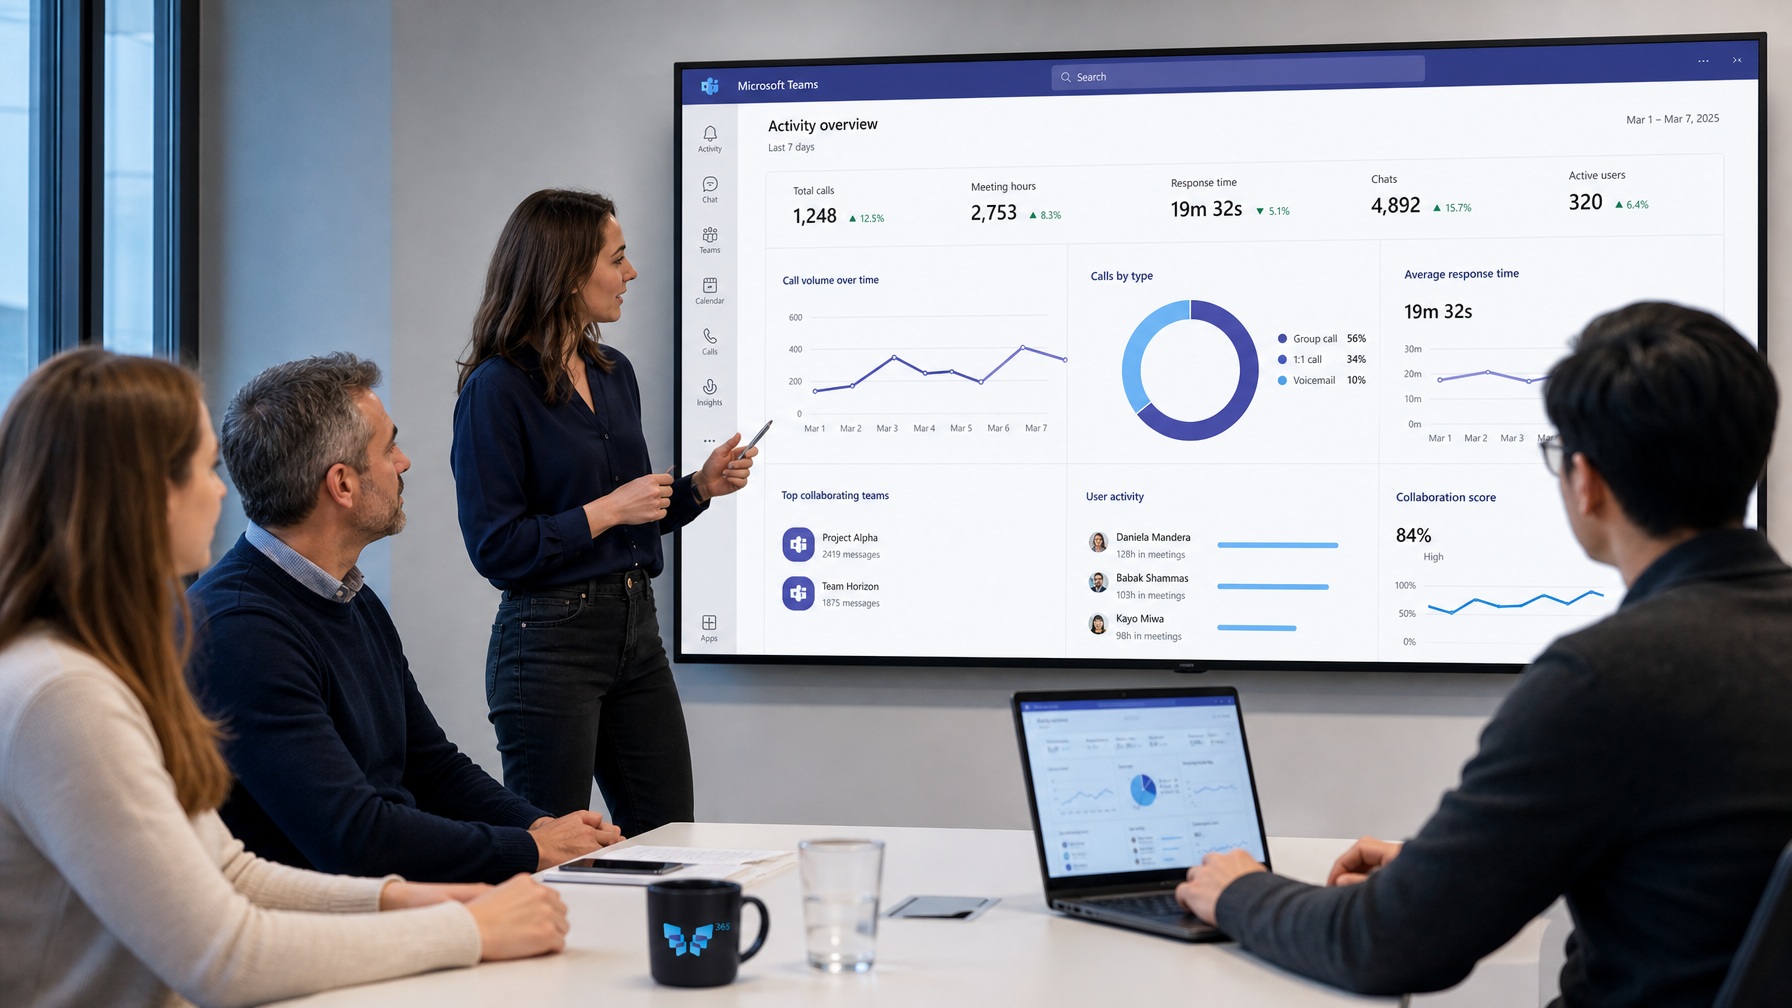
- Teams Admin Center: basic data about calls and call quality.
- Microsoft Power BI Reports: historical reports on auto attendants and call queues.
- The Queues App in Teams: real-time insights for team leaders, part of Teams Premium.
- Specialized Reporting Tools: for dashboards, wallboards, and management reports without your own Power BI work.
Measuring is just the beginning
A dashboard alone solves nothing. Agree on who looks at which numbers and what you do if a number deviates. A team leader who spends five minutes looking at yesterday’s figures every morning improves more than a monthly report that no one reads.
Choose your goals wisely
A service level of 95% sounds nice, but requires a lot of staffing. Choose goals that fit your customers and your team. A municipality with a public line has different requirements than an internal IT helpdesk.
From feeling to facts
With 365 Phone Insight, you make accessibility measurable with dashboards and reports for management and team leaders. This way, you focus on facts, not complaints.
Want to know how accessible your organization really is? Schedule a consultation and we'll show you what insights you can have as early as tomorrow.
Frequently Asked Questions
What is a good service level?
A commonly used standard is 80% within 20 seconds. But the right standard depends on your sector and your customers.
Can I see in real-time how many people are waiting?
Yes. With the Queues app or a wallboard, team leaders can see live what's happening in the queue.
Do I need Power BI knowledge?
Not necessarily. There are ready-to-use reports and tools that don't require your own Power BI work.